
II. Definitions
- Electrocardiogram (EKG)
- Heart electrical activity over time as recorded graphically by an electrocardiograph
III. Background
- See Cardiac Electrophysiology Anatomy
- Interpretation requires patient age, EKG indication
- Images


IV. Precautions
- Standard EKG speed and amplitude is nearly always the best setting
- Although EKG gain can be increased and EKG speed can be slowed, the result is often more difficult to interpret
- Do not rely on computerized EKG Interpretation (aside from interval measurement)
- There is no standardization for software quality across EKG manufacturers and accuracy varies widely
- Computer interpretations miss STEMIs in up to 23-41% of cases
- Atrial Fibrillation is a frequent False Positive on computer interpretations
- Pacemaker rhythms are frequently misinterpreted by computers (STEMI False Positives and False Negatives)
- References
- Orman and Mattu in Herbert (2018) EM:Rap 18(3): 1-2
- Schlapfer (2017) J Am Coll Cardiol 70(9): 1183-92 [PubMed]
- Willems (1991) N Engl J Med 325(25):1767-73 +PMID:1834940 [PubMed]
V. Components: EKG Paper
- Record speed: 25 mm/sec
- Small square (1 mm): 0.04 seconds
- Large square (5 mm): 0.20 seconds
- Standard EKG contains distance markers that are 15 large boxes wide (3 seconds in duration)
VI. Components: Leads
-
General
- Electrical cardiac signals traveling toward positive lead are upright on EKG
- Electrical cardiac signals traveling away from positive lead are negative or oriented down on EKG
- Most leads are primarily positive (P Wave and QRS), except aVR and V1
- Limb leads (bipolar, vector to positive lead)
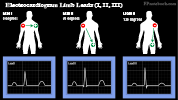
- Lead I: Left arm (+) - Right arm (-), 0 degrees
- Lead II: Left leg (+) - Right arm (-), 60 degrees
- Lead III: Left leg (+) - Left arm (-), 120 degrees
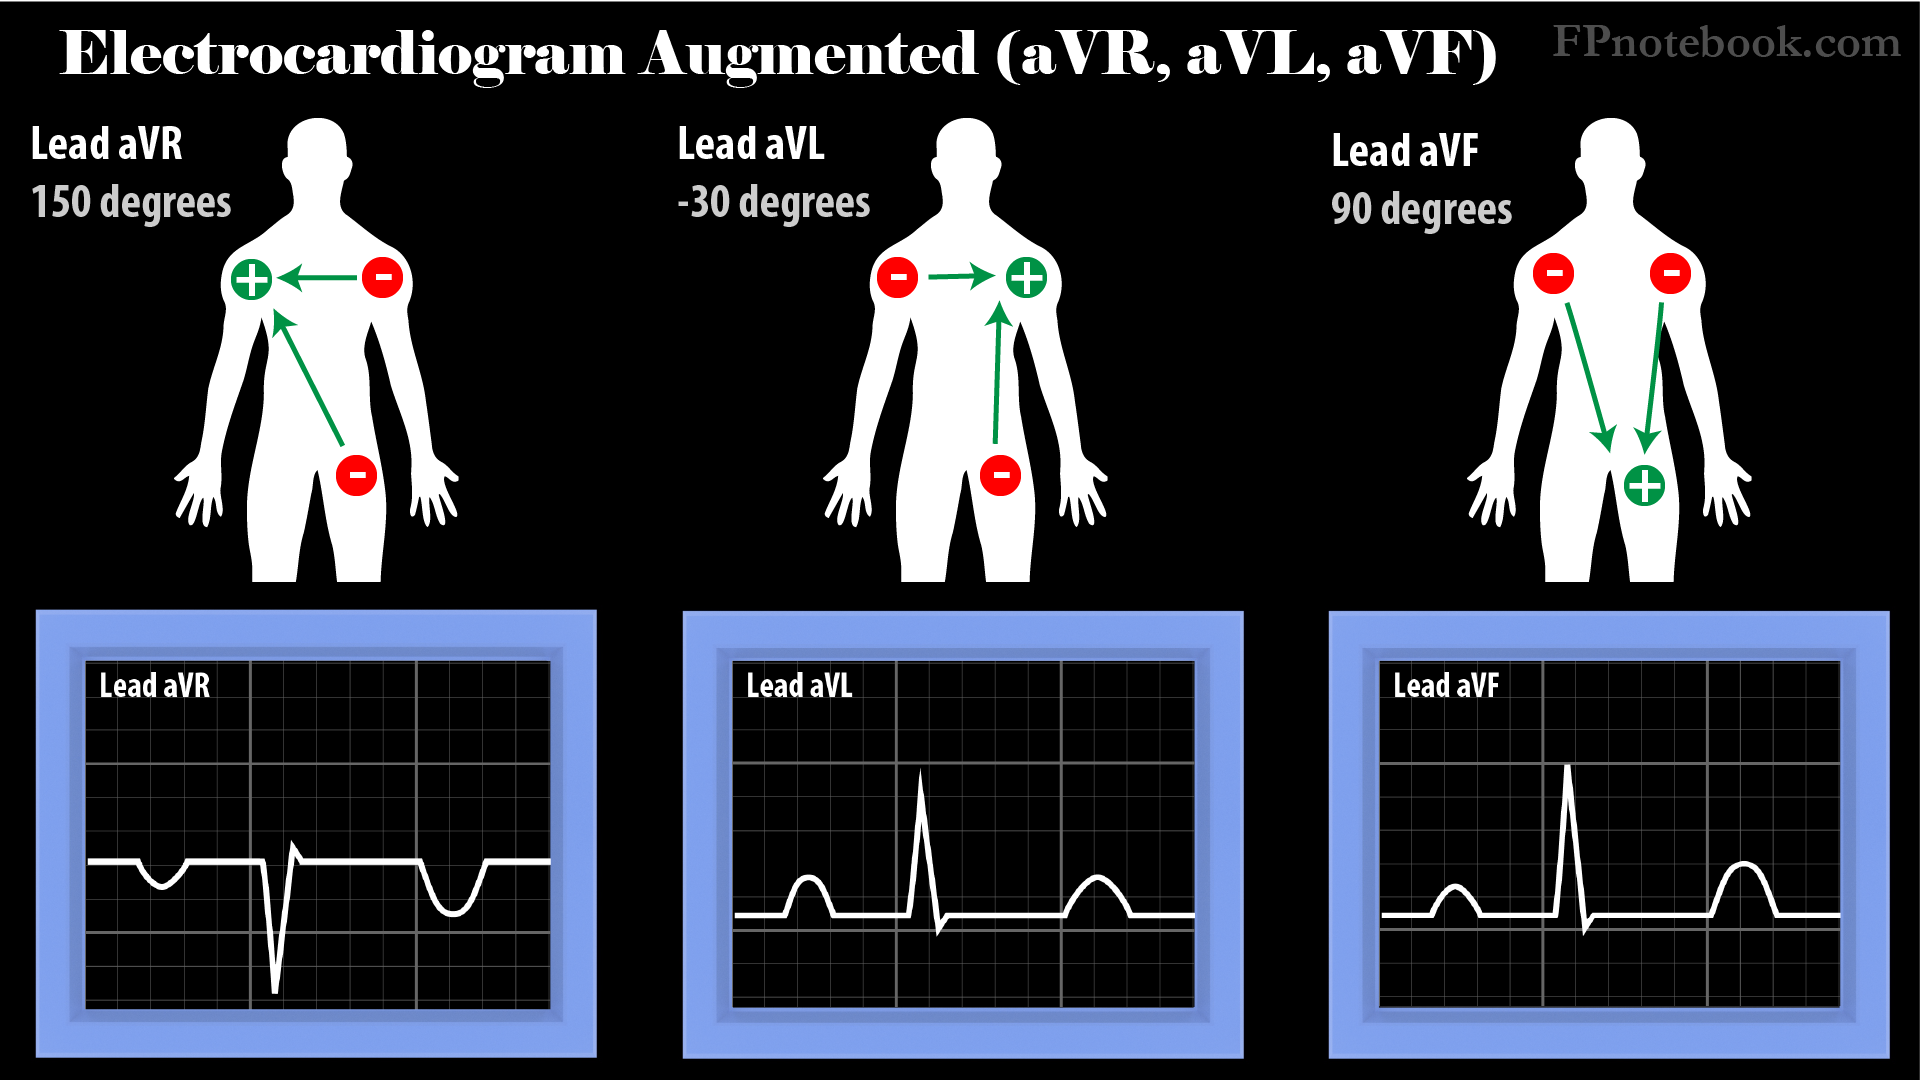
- Augmented Limb Leads (unipolar, vector to positive lead)
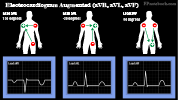
- Lead aVR: Right arm (+) - Left arm/leg (-), -150 degrees
- Lead aVL: Left arm (+) - Right arm/Left leg (-), -30 degrees
- Lead aVF: Left leg (+) - Right arm/left arm (-), 90 degrees (directly down, toward feet)
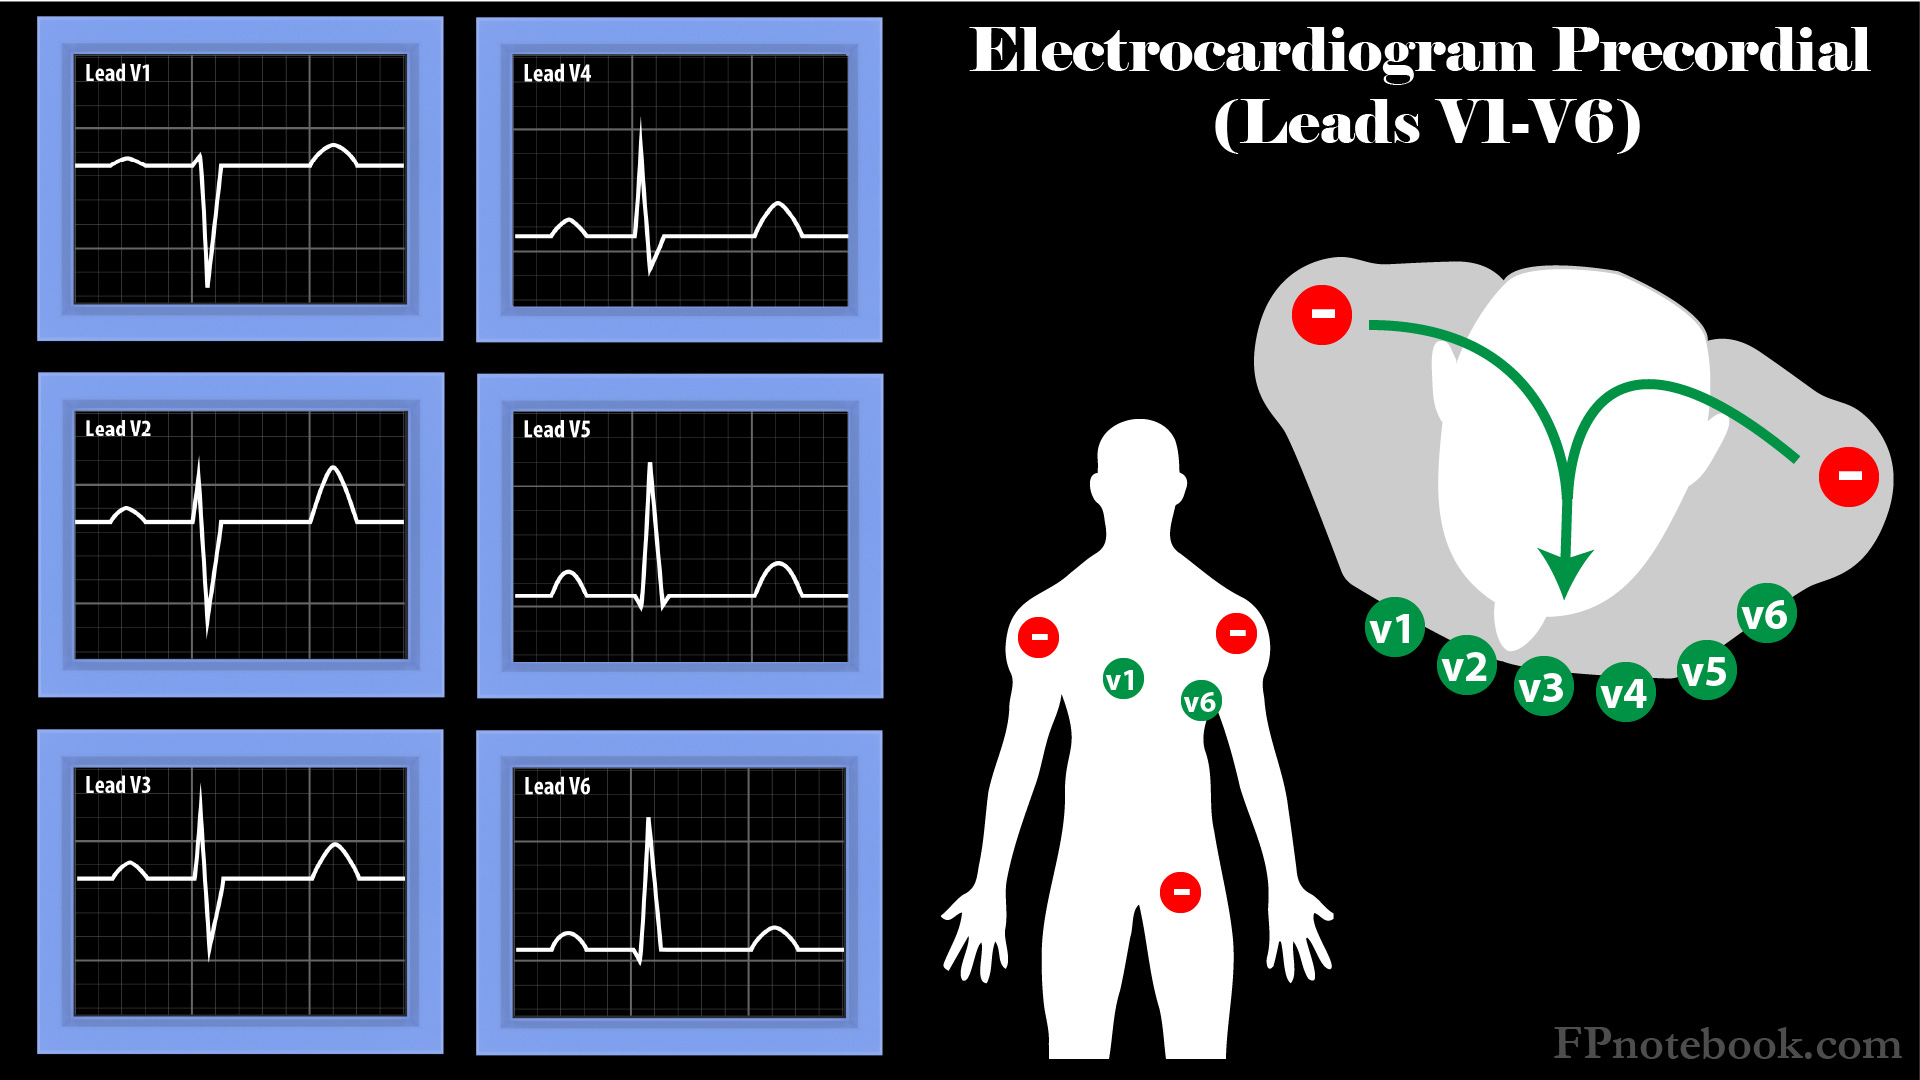
- Precordial Leads (unipolar chest)
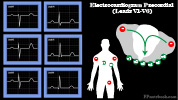
- Vector from posterior (combined, negative limb leads) to anterior (chest positive, precordial leads)
- QRS grows gradually more upright in transition from V1 to V6 (see R Wave Progression)
- Ventricular depolarization passes from subendocardial to subepicardial, mostly toward anterior chest
- Lead V1: Right sternal border (Right Ventricle)
- Lead V2: Left sternal border
- Lead V3: Medial Breast (Septum)
- Lead V4: Nipple
- Lead V5: Lateral Breast
- Lead V6: Lateral chest wall (Left Ventricle)

VII. Evaluation: Approach
- Assess EKG Validity
- Rate and Rhythm: "Watch your P's and Q's and the 3R's"
- P Waves
- Not sinus rhythm if P Waves absent, or not upright in Lead II
- QRS Complex wide or narrow?
- Rate (see EKG Rate)?
- Regularity of Rhythm?
- Relationship between P Waves and QRS Complex
- P Waves
-
EKG Axis
-
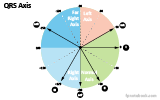
- Cardiac depolarization normally moves from upper right to lower left
-
- Intervals (prolonged?)
- Hypertrophy?
- Left Ventricular Hypertrophy
- Right Ventricular Hypertrophy
- Right Atrial Enlargement
- Left Atrial Enlargement
- Infarction?
- Reference
- Grauer (2001) 12 Lead EKGs, KG/EKG Press, Gainesville

VIII. Interpretation: Specific Circumstances
- See Electrocardiogram in Myocardial Infarction
- See EKG Changes in Syncope due to Arrhythmia
- See Electrocardiogram in Atrial Fibrillation
- See EKG Changes During Pregnancy
- See Electrocardiogram in Children
- See Hyperkalemia Related EKG Changes
- See Hypokalemia Related EKG Changes
-
Ventricular Tachycardia
- Northwest axis (opposite Nl axis)
- V1-V6 positive QRS Complex
- See AV dissociation
-
Pericarditis
- See Electrocardiogram in Pericarditis
- Stage I: Diffuse ST inc all leads except aVR, V1
- Stage II: ST Segments temporarily normalize
- Stage III: Diffuse ST depress +/- T inversion
- Stage IV: Gradual normalization of ST and T Waves
-
Pulmonary Embolism
- See Electrocardiogram in Pulmonary Embolism
- Right Strain Pattern (Classic PE, but rarely seen)
-
Atrial Fibrillation or Atrial Flutter with Rapid Ventricular Rate
- See Electrocardiogram in Atrial Fibrillation
- At a rapid rate (e.g. 140-150 bpm), may be difficult to differentiate AFib/Flutter from ST, PSVT
- Increase EKG "paper speed" to 50 mm/sec (rapid) to spread out complexes (P Waves may be seen)
- Mattu (2020) Crit Dec Emerg Med 34(4): 18