
II. Physiology
- Most oxygen (97%) is transported in circulation bound to Hemoglobin
- Oxygen is otherwise poorly soluble in plasma
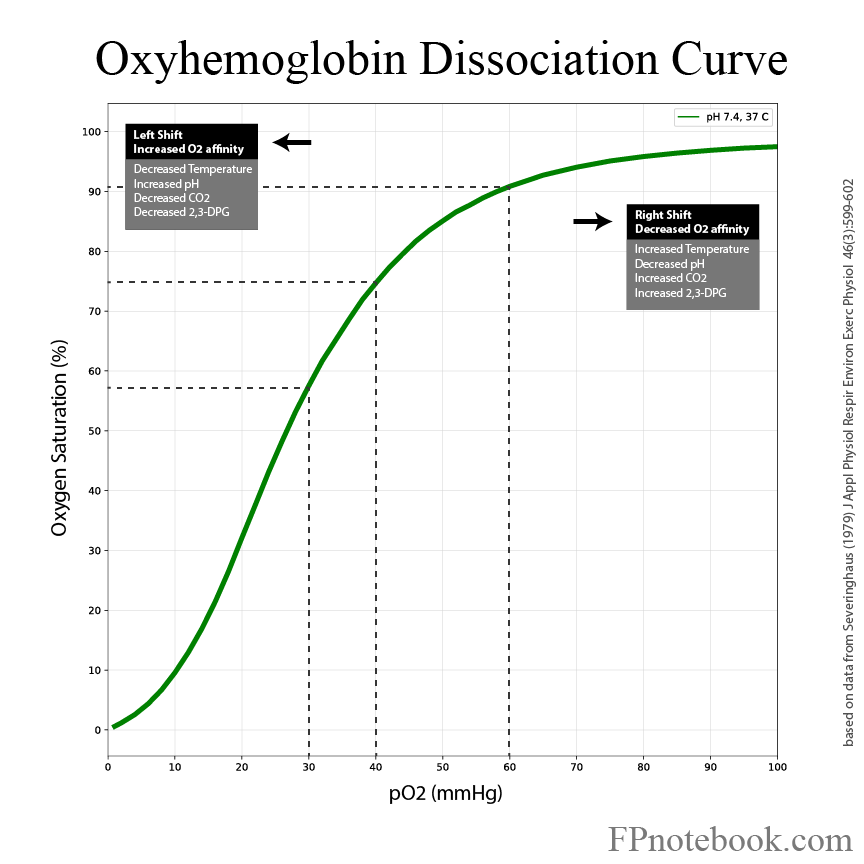
- Oxygen dissociation curve
- Facilitates oxygen binding in the alveoli even at low inspired oxygen concentrations
- Hemoglobin remains well saturated (90%) even when alveolar oxygen drops to 60 mmHg
- However, at very low levels of alveolar oxygen (<40 mmHg), Hemoglobin remains poorly saturated
- Facilitates oxygen release for tissue delivery at adequate levels, but not excessive
- Hemoglobin releases oxygen to tissues where oxygen concentration is typically 20-40 mmHg
- Peripheral tissue acidosis (lower pH) shifts the curve right, with greater release of oxygen to tissue
- Oxygen dissociation curve shifts with environmental conditions
- See Shifted Oxygen Saturation Curve below
- Curve shifts right with physiologic stress (fever, increased PaCO2, decreased pH)
- Hemoglobin releases more oxygen for a given Oxygen Saturation
- Images
- Facilitates oxygen binding in the alveoli even at low inspired oxygen concentrations
III. Mechanism: Oxygen Saturation
- Oximeter probe applied to a finger, toe or ear lobe
- Light transmission circuit
- Light emitted by 2 LEDs (one red and one infrared)
- Light transmits through blood and soft tissue and is partially absorbed
- Oxygenated Hemoglobin Absorbs light at a different rate than deoxygenated Hemoglobin
- Light received by a photodiode opposite the LED
- Oxygen Saturation calculated based on the Oxyhemoglobin Saturation
IV. Mechanism: Perfusion Index
- Perfusion Index may also be interpreted from Pulse Oximeter waveform
- Reflects the strength of the pulse arriving at the detector
- Perfusion Index is the ratio of pulsatile to nonpulsatile blood
- Unlike oximetry which detects Oxygen Saturation, Perfusion Index reflects Blood Flow
- Waveform will not improve with oxygenation
- Waveform improves with increased Cardiac Output or vasodilation
- Normal Perfusion Index 0.3 to 20
- Oxygen Saturation waveform is lost at ratio <0.5
- Decreased Perfusion Index causes
- Decreased Cardiac Output (e.g. Cardiogenic Shock)
- Vasoconstriction (e.g. Hemorrhagic Shock)
- References
- Weingart and Swaminathan in Herbert (2021) EM:Rap 21(9): 6-7
V. Precautions
- Oxygen Saturation under ideal conditions is +/- 2%
- Oxygen Saturation can miss a large A-a Gradient
- Oxygen Saturation can be 100% when PaO2 is 90 mmHg or 300 mmHg
- At a high FIO2 of Supplemental Oxygen, Oxygen Saturation cannot distinguish a PaO2 above 90 mmHg
- Normal PaO2 on FIO2 100% should be >500 mmHg
- Normal PaO2 on FIO2 50% should be >250 mmHg (linear relationship)
- Oxygen Saturation drop is delayed in apnea
- Supplemental Oxygen maintains oxygenation without desaturation for minutes despite apnea (see Apneic Oxygenation)
- Carbon dioxide however increases with apnea and Respiratory Acidosis develops
- End-Tidal CO2 is a better monitor of respiratory status (reflects apnea minutes before Oxygen Saturation drops)
- Oxygen Saturation has a very steep drop off below 90-93%
- See Oxygen Saturation to PaO2 Relationship below
- PaO2 falls off rapidly, dropping to 60 mmHg at 90% Oygen Saturation
- Oxygen Delivery is dependent on both Oxygen Saturation and Cardiac Output
- At normal Cardiac Output, a PaO2 50 mmHg might be sustained for months
- With decreased cardiac ouput and other comorbidity, PaO2 50 mmHg may trigger rapid decompensation
- Further drops in PaO2 become non-sustainable even with normal Cardiac Output
- Oxygen Saturation may be falsely increased by Dehydration
- Expect an imperfect Oxygen Saturation (93-95%) on room air in patients with underlying cardiolpulmonary disease
- Suspect Dehydration if patient has ventilation-perfusion mismatch but has 100% O2 Sat on room air
- References
- Shipsey in Majoewsky (2012) EM:RAP 12(4): 3-4
VI. Interpretation: Factors reducing Oxygen Saturation reliability and accuracy
- Conditions with falsely depressed Oxygen Saturation
- Interference
- Nail polish or false nails
- Excessive sensor motion or poorly adherent detector
- Bright or intense Ambient light
- Severe Anemia (Hematocrit <15%)
- Reduced Blood Flow (consider using central location for detector such as forehead)
- Vasoconstriction
- Hypotension
- Blood Pressure cuff on arm with sensor
- Hypothermia
- Raynaud's Phenomenon
- Interference
- Conditions with falsely elevated Oxygen Saturation
- Severe Dehydration
- Carboxyhemoglobin (Carbon Monoxide Poisoning)
- Methemoglobinemia
- Tachypnea
- Lipid suspensions (e.g. Propofol) or Hyperlipidemia
- Darker skin (e.g. black)
- Target Oxygen Saturation >94% in dark skin, and Oxygen Saturation >92% in light skin
VII. Interpretation: Newborns
- Oxygen Saturation does not normally increase to >85% until after 10 minutes of life in newborns
- Normal Oxygen Saturation by minutes of life
- Oxygen Saturation at 1 minute: 60-65%
- Oxygen Saturation at 2 minutes: 65-70%
- Oxygen Saturation at 3 minutes: 70-75%
- Oxygen Saturation at 5 minutes: 80-85%
- Oxygen Saturation at 10 minutes: 85-90%
- References
- Claudius, Behar, Nichols in Herbert (2015) EM:Rap 15(1): 3-4
VIII. Physiology: Arterial Blood Oxygen Content (CaO2)
- CaO2 = Hgb * 1.34 * SaO2 + (0.003 * PaO2)
- Where CaO2 is Arterial Blood Oxygen Content in ml O2/dl
- Where Hgb is Hemoglobin in g/dl
- Where SaO2 is Oxygen Saturation in % (O2Sat, fraction e.g. 0.95 = 95%)
- Where PaO2 is Partial Pressure of oxygen in mmHg
- Normal CaO2 = 18-20 ml/dl
- Given normal Hemoglobin And Oxygen Saturation
-
Hemoglobin (as key oxygen transporter) is the most important contributor to oxygen availability to tissues
- Each gram Hemoglobin transports 1.34 ml oxygen
- Dissolved oyxgen contributes minimally to Oxygen Delivery at tissue level
- Reflected in the equation by (0.003 * PaO2)
IX. Physiology: Oxygen Saturation to PaO2 Relationship
- Non-Shifted Oxygen Saturation (unreliable above 97%)
- Mnemonic:
- 30-60%
- 60-90%
- 40-75%
X. Physiology: Shifted Oxygen Saturation Curve (Oxyhemoglobin Dissociation Curve)
-
Left Shift (pathologic causes)
- Background
- Same O2 Sat implies lower PaO2, higher O2 affinity, less O2 tissue delivery
- Hemoglobin releases less oxygen for a given Oxygen Saturation
- Increased pH
- Decreased Temperature (Hypothermia)
- Decreased PaCO2
- Decreased 2,3-DPG (2,3-Diphosphoglycerate)
- Carbon Monoxide Poisoning
- Methemoglobinemia
- Background
- Right Shift (physiologic stress)
- Background
- Same O2 Sat implies higher PaO2, lower O2 affinity, greater O2 tissue delivery
- Hemoglobin releases more oxygen for a given Oxygen Saturation
- Increased Temperature (hyperthermia)
- Increased PaCO2
- Increased 2,3-DPG (2,3-Diphosphoglycerate)
- Chronic Hypoxemia increases 2,3-DPG, and allows for maximal Oxygen Saturation of Hemoglobin
- Decreased pH (acidosis)
- Background
- Images
XI. References
- Killu and Sarani (2016) Fundamental Critical Care Support, p. 93-114