
II. Physiology: Energy Sources
- See Gastrointestinal Metabolism
- Background
- Ingested food is lysed into small component molecules for intestinal absorption
- Starches and Disaccharides are lysed into Monosaccharides
- Proteins are lysed into Amino Acids and some short-chain peptides
- Fats are lysed into free Fatty Acids and Cholesterol
- Intestinal epithelial cell absorption
- Simple diffusion (passive absorption) of free Fatty Acids, monoglycerides and water
- Active transport (esp. Sodium-Potassium ATPase pump) for most other molecules
- Portal circulation carries most absorbed energy sources to liver (except fats)
- Carbohydrates (the Monosaccharides Glucose, fructose and galactose)
- Proteins (Amino Acids and short-chain peptides)
- Short fatty-acids (remainder of fats are carried by Lymphatics)
- Lymphatics carry most absorbed fats
- Fats are carried by Chylomicrons via Lymphatics after intestinal absorption (see below)
- Malabsorption has many mechanisms
- Lactose Intolerance (Lactase Deficiency)
- Pernicious Anemia (Vitamin B12 Deficiency from Intrinsic Factor deficiency)
- Celiac Disease (gluten-mediated injury to intestinal villi)
- Energy sources by organ utilization
- Glucose
- Primary source of energy for most cells
- Ketones
- Secondary source of energy for the brain, heart and Muscle during starvation
- Fatty Acids
- Secondary source of energy in most cells during times of Hypoglycemia or starvation
- Fatty Acids do not cross the blood brain barrier (brain is unable to use Fatty Acids as fuel)
- Lactic Acid
- Liver uses Lactic Acid for energy after a meal
- Lactic Acid may fulfill energy demands in the brain (up to 70-75%) and heart (up to 20 to 25%)
- Glucose
- Ingested food is lysed into small component molecules for intestinal absorption
-
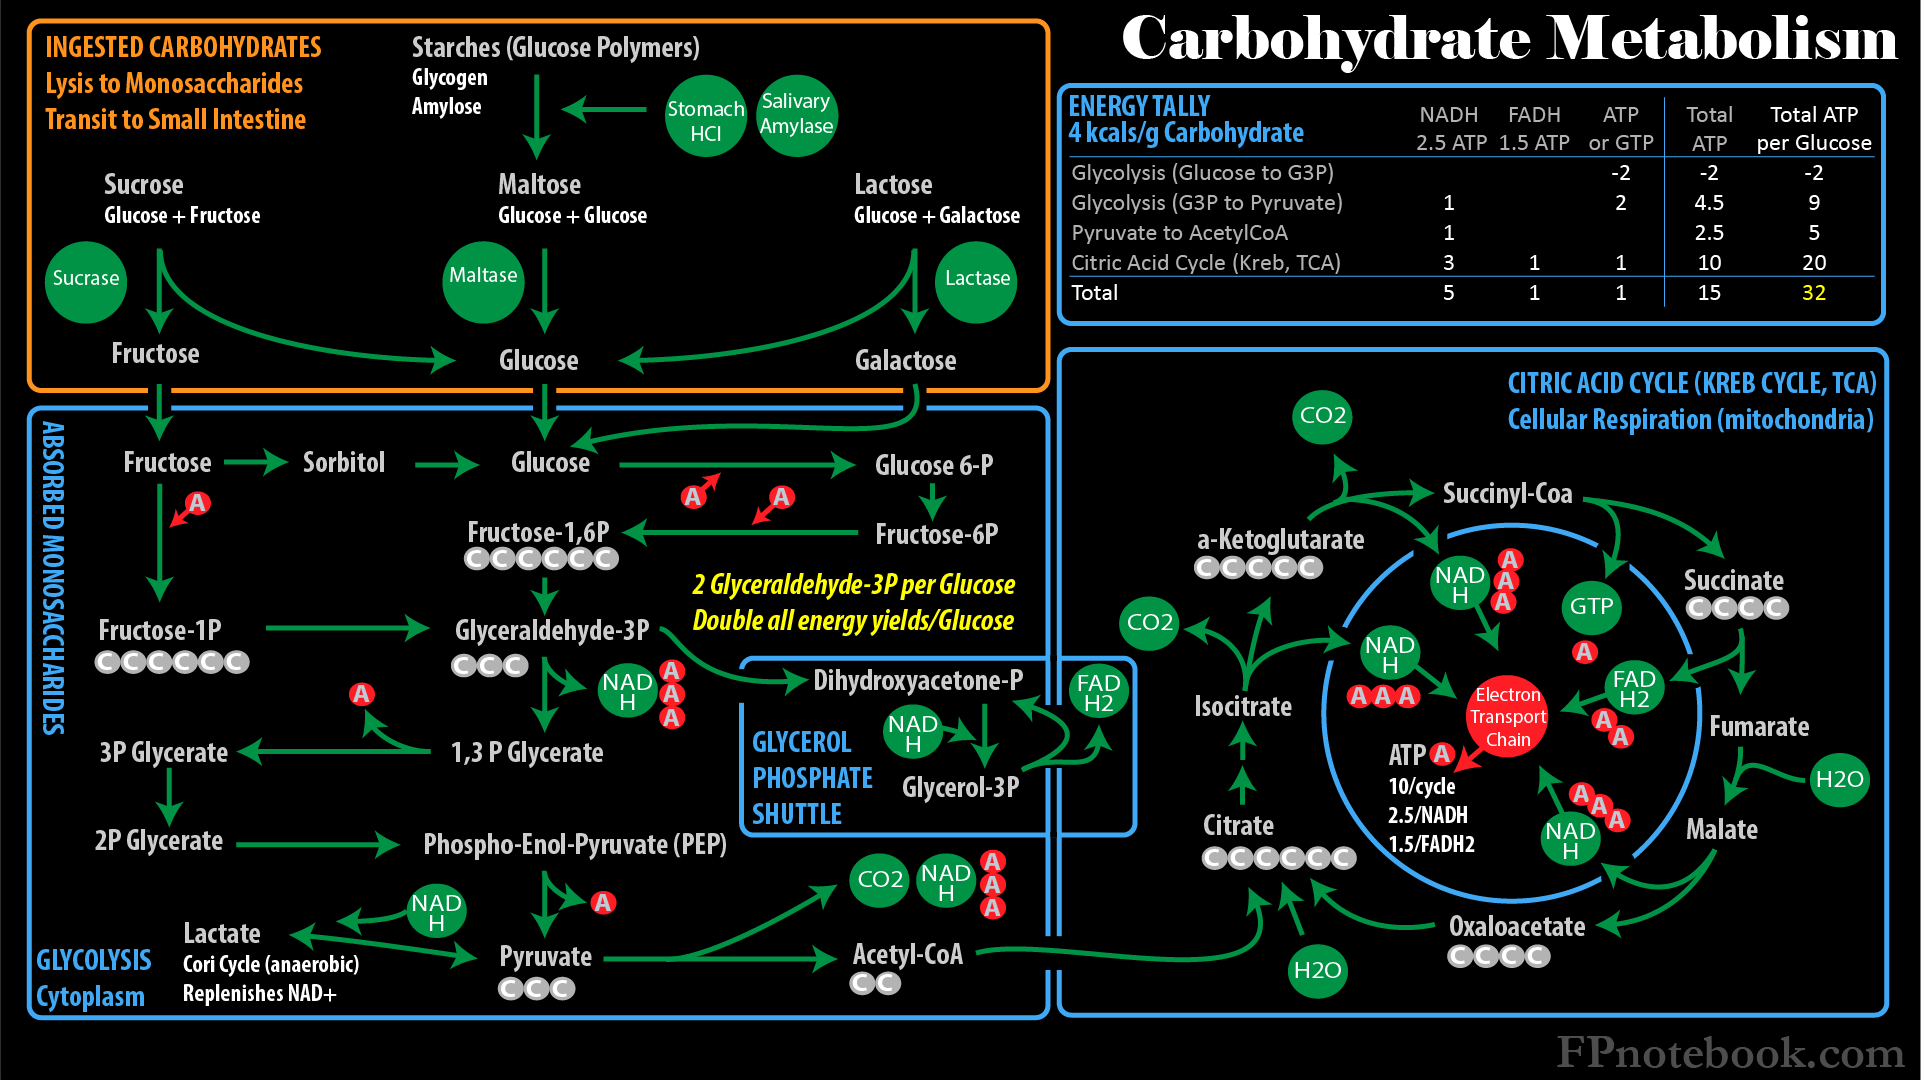
Carbohydrates (4 kcals/g)
- See Glucose Metabolism
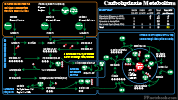
- Stores exhausted in first day of starvation
- Starches and Disaccharides are cleaved into Monosaccharides before intestinal absorption
- Mediated by Stomach acid and Salivary, intestinal and Pancreatic Enzymes (see below)
- Starches (Glucose polymers, cleaved by amylase into maltose)
- Glycogen
- Amylose
- Disaccharides
- Monosaccharides
- Glucose
- Fructose
- Galactose
-
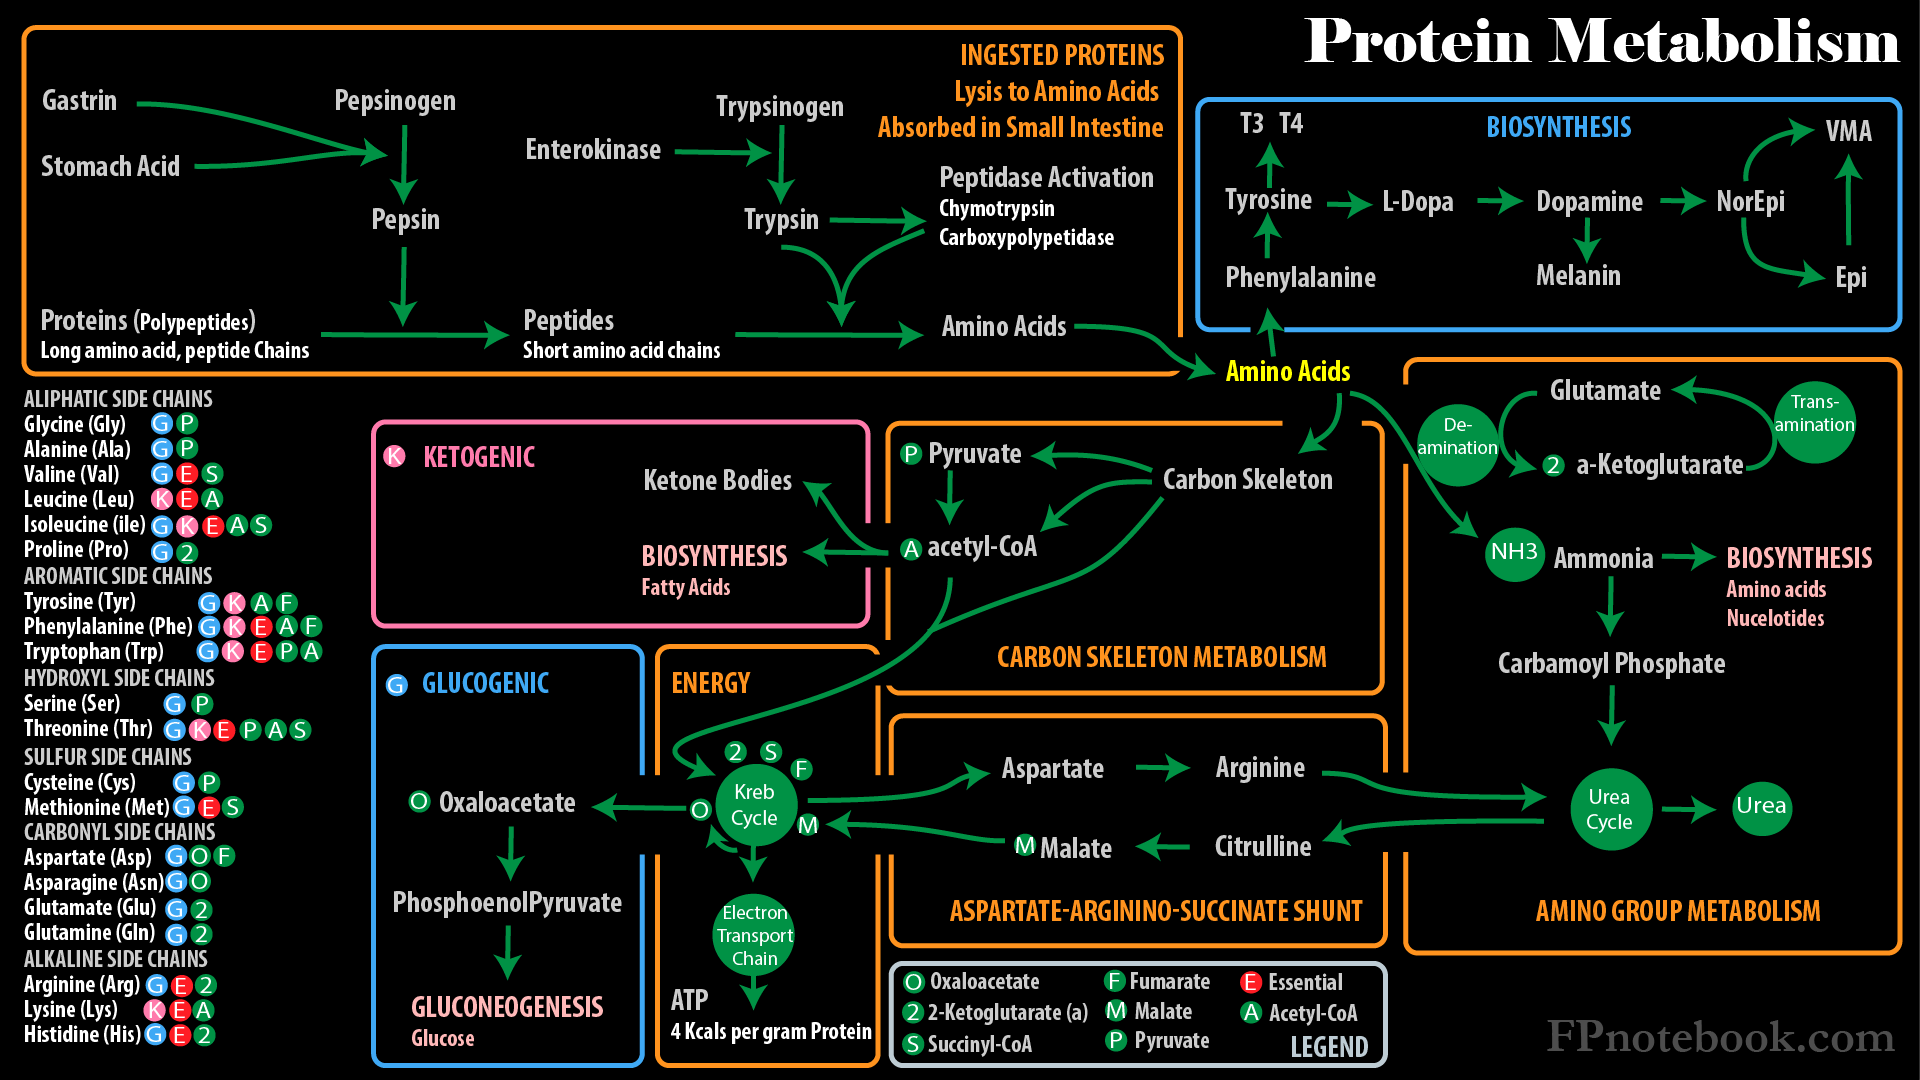
Protein (4 kcals/g)
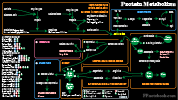
- Last to be catabolized in starvation
- Proteins are broken down to Amino Acids and some small peptides before absorption
- Mediated by Stomach acid, pepsin, trypsin and peptidases (see below)
- Proteins (polypeptides)
- Long chains of peptides (which in turn are chains of Amino Acids)
- Peptides
- Short chains of Amino Acids (two or more)
- Amino Acids
- Twenty common Amino Acids occur in humans, in which 9 are essential (must be ingested)
- Fat (9 kcals/g)
- See Fatty Acid
- See Cholesterol
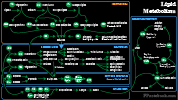
- Long term energy source
- Intestinal Digestion and Absorption of fats
- Duodenal bile salts emulsify fats into small droplets
- Enzymatic breakdown by intestinal and pancreatic agents
- Lipase (intestinal, pancreatic) lyse Triglycerides to monoglycerides and free Fatty Acids
- Esterases lyse Cholesterol to free Cholesterol and free Fatty Acids
- Phospholipases lyse phospholipids to free Fatty Acids and lysophospholipids
- Small micelles form from fat breakdown products and bile acids
- Micelles carry fats to intestinal epithelial cell brush border for absorption
- Bile salts allow for absorption of polar lipids
- Bile salts are reclaimed by enterohepatic circulation
- Bile salts absorbed in ileum are transported back to liver via portal circulation
- Intestinal Epithelial cell Processing of Fats
- Re-forming of lipids
- Triglycerides re-form from free Fatty Acids and monoglycerides
- Cholesterol esters re-form from free Fatty Acids and Cholesterol
- Phospholipids re-form from free Fatty Acids and lysophospholipids
- Chylomicrons
- Form from Apoproteins combined with Triglycerides, Cholesterol to phospholipids
- Chylomicrons move from intestinal epithelial cells into Lymphatic System
- Triglycerides are carried by Chylomicrons to Muscle and fat cells
- Triglycerides are lysed into free Fatty Acids by capillary LipoproteinLipase
- Free Fatty Acids are then absorbed by Muscle and fat cells
- Triglycerides reform from free Fatty Acids within Muscle and fat cells (esterification)
- Other Lipoproteins (VLDL, LDL, HDL)
- Form from Cholesterol processing in the liver
- Re-forming of lipids

III. Physiology: Glucose Metabolism Pathways
- See Glucose Metabolism
- See Fatty Acid
-
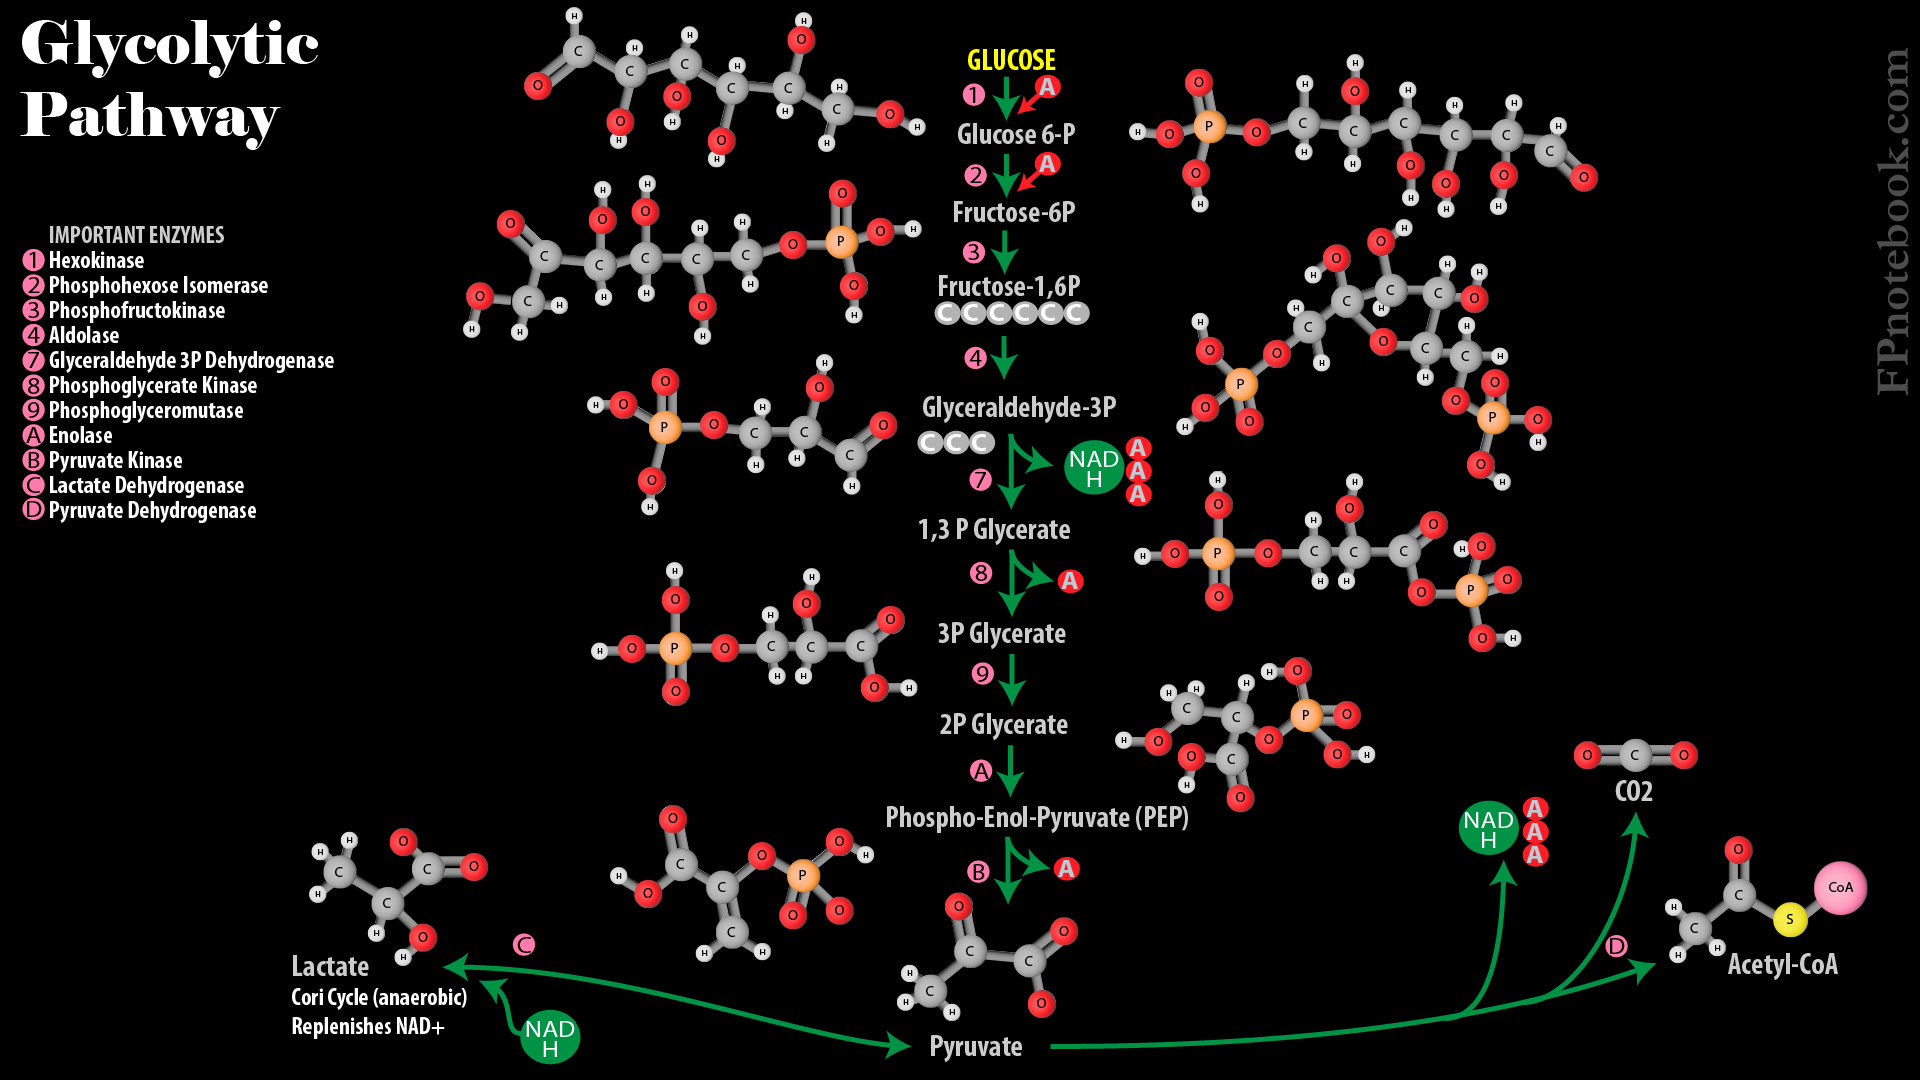
Glycolysis (Embden-Meyerhoff Pathway)
- Catabolic pathway to breakdown Carbohydrates (Glucose, fructose) into pyruvate, without need for oxygen
- Represents only a small part of the overall energygeneration from Carbohydrates (2 net ATP and 1 NADH)
- Pyruvate may then be converted to Lactic Acid or acetyl-CoA (which enters TCA Cycle or is used to form Triglycerides)
- Triggered by Insulin, which lowers Glucose via both Glycolysis as well as increasing glycogen stores
-
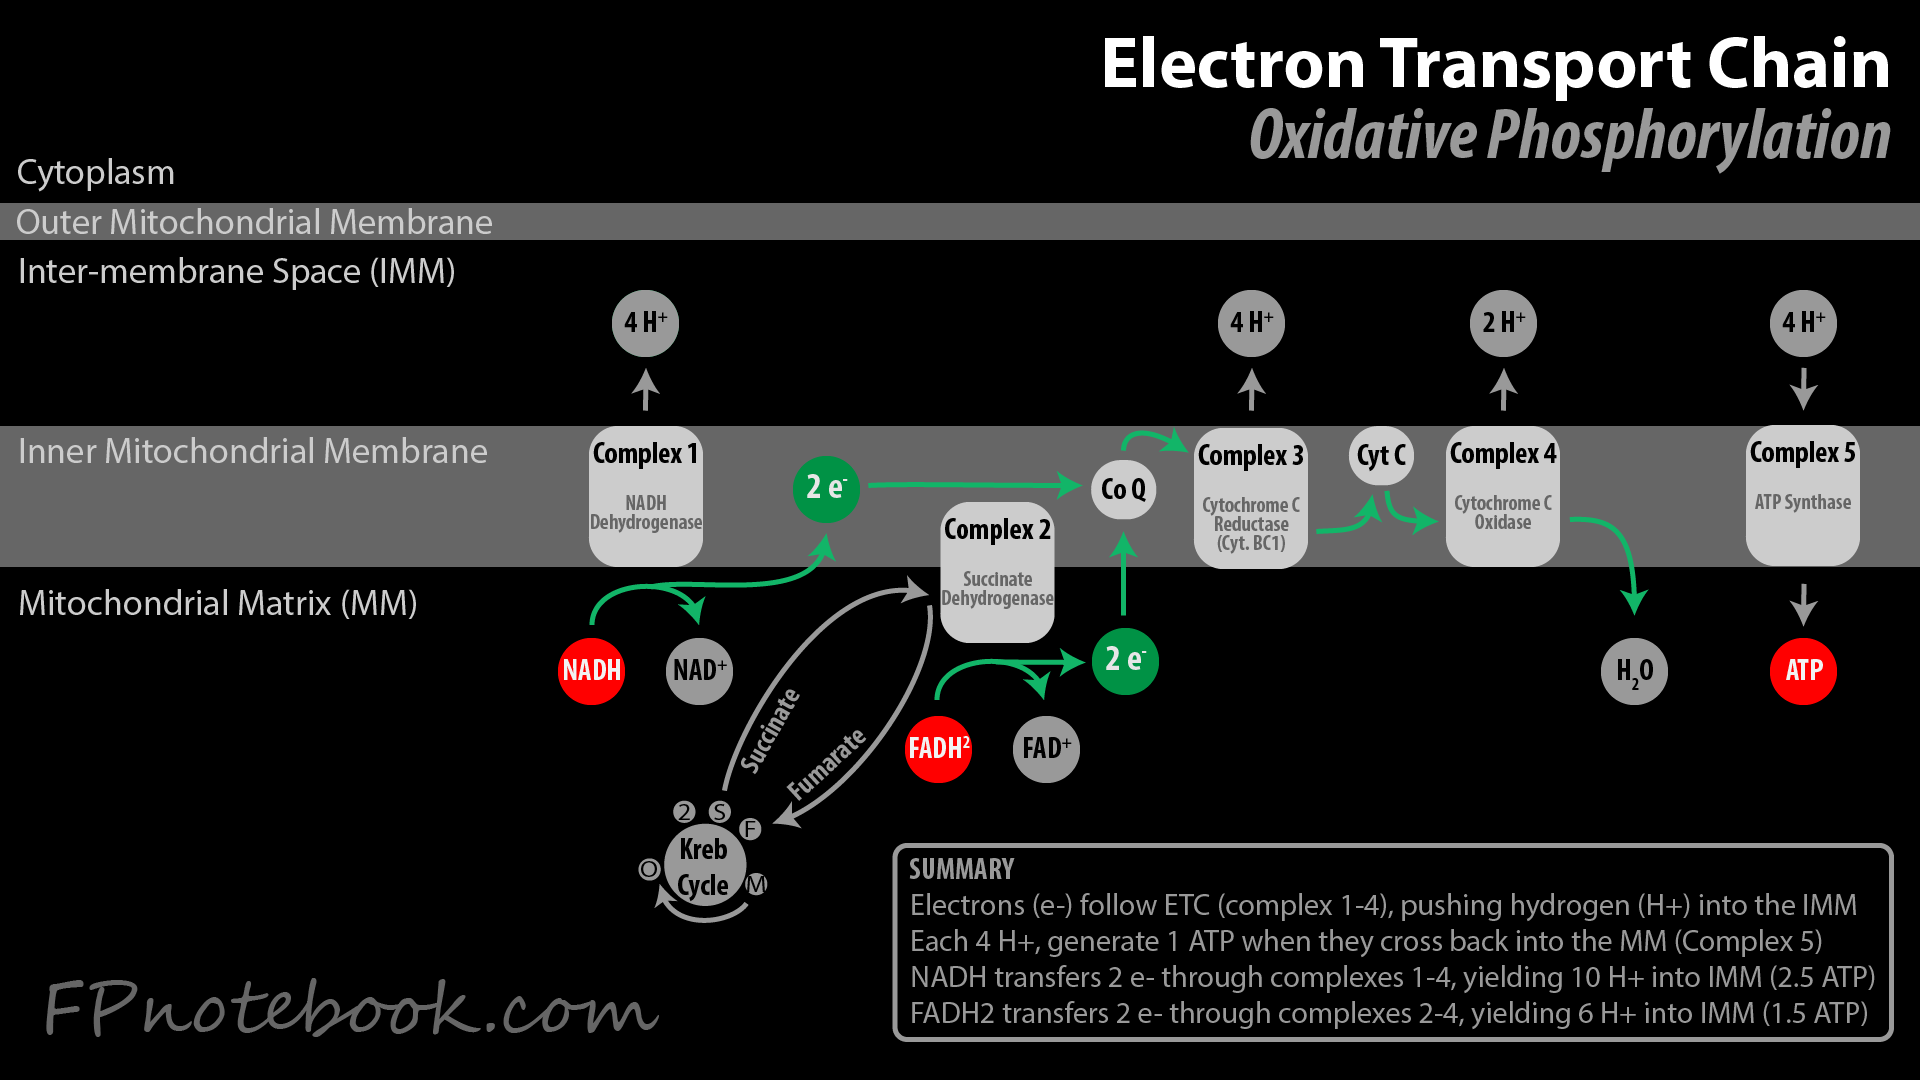
Citric Acid Cycle (Krebs Cycle, Tricarboxylic Acid Cycle, TCA Cycle)
- Universal pathway seen across multicellular organisms, taking place in mitochondria in humans
- Generates energy from Acetyl CoA (3 NADH, 1 FADH, 1 GTP) derived from Glucose, Amino Acids and Fatty Acids
- Intermediate steps include oxaloacetate, isocitrate, a-Ketoglutarate, succinyl-CoA, Succinate, fumarate, malate
-
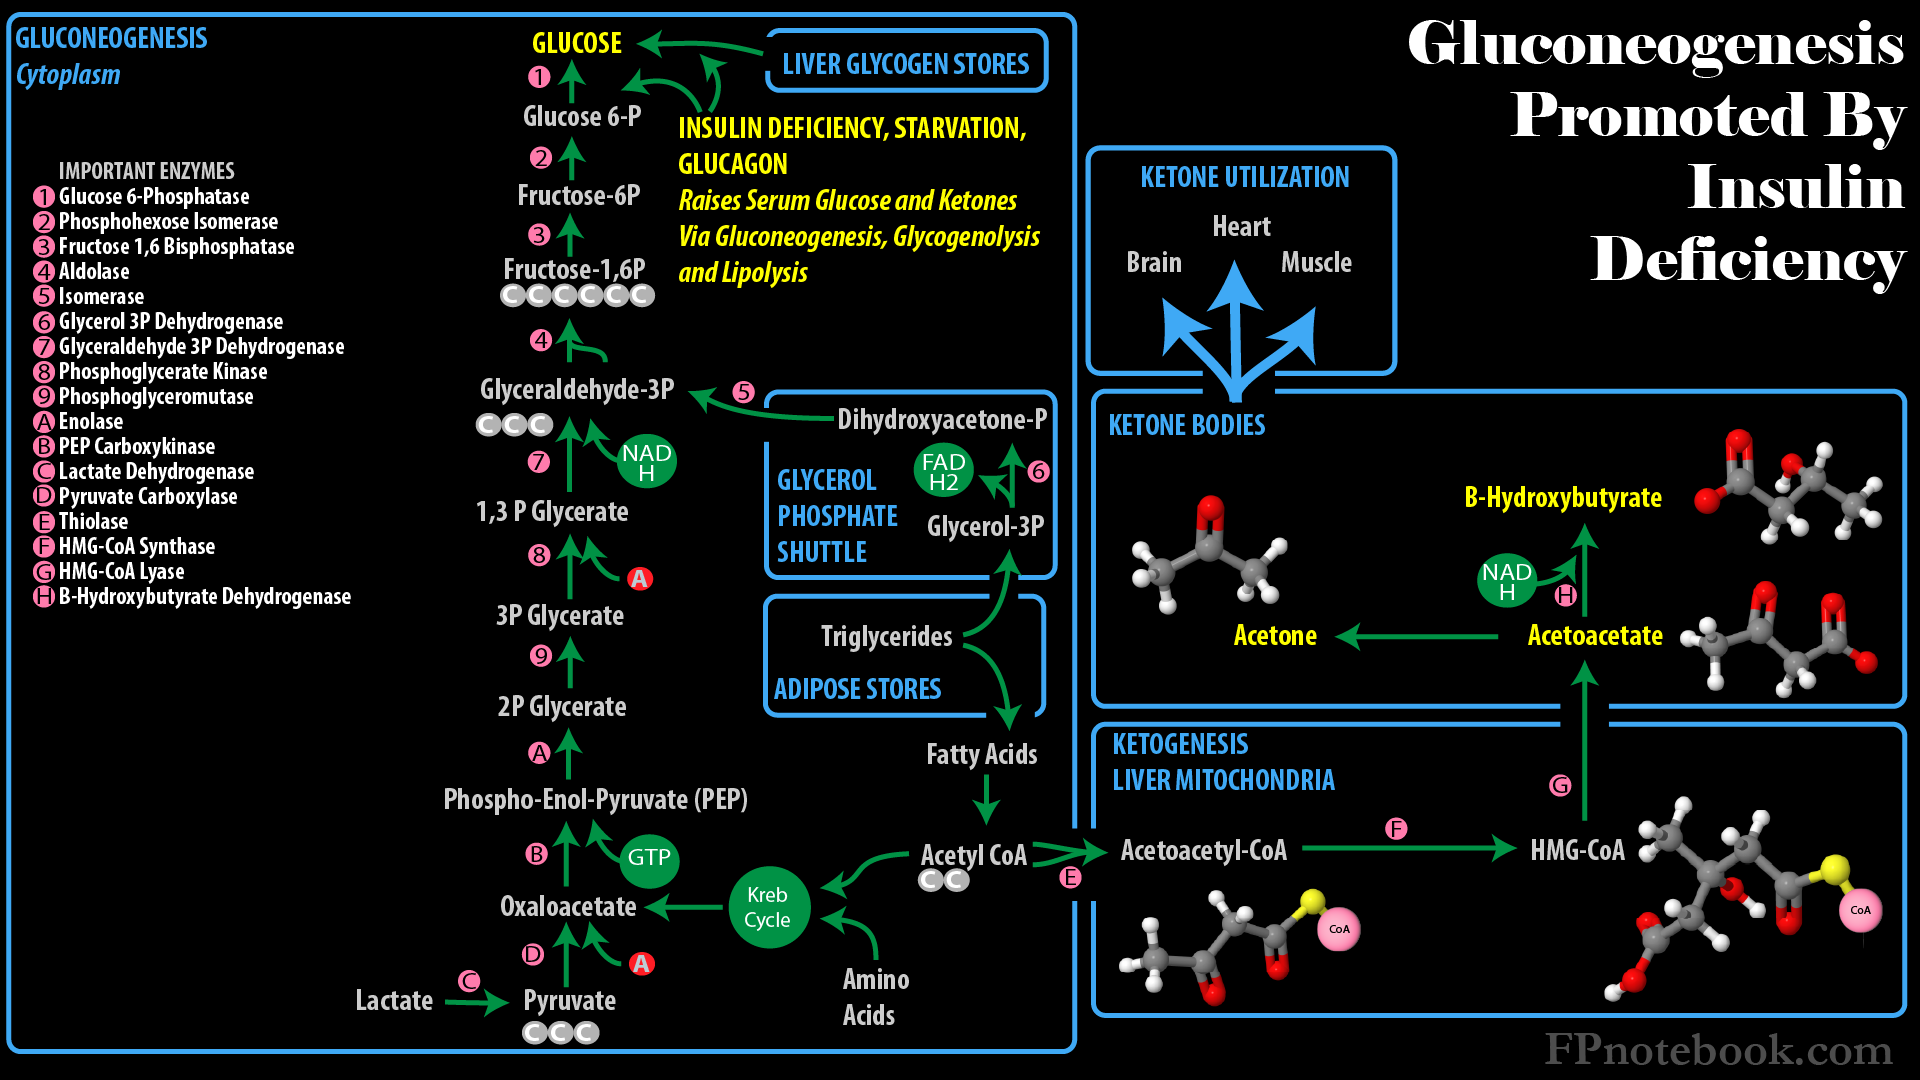
Gluconeogenesis
-
- Pathway forms Glucose from 3- or 4-carbon noncarbohydrate precursors (e.g. pyruvate, Amino Acids and Glycerol)
- Process takes place in the Kidneys and liver and is triggered when Insulin levels are low and in starvation states
- The same triggers for Gluconeogenesis also trigger Lipolysis and Ketogenesis
-


IV. Physiology: Fatty Acid Metabolism
- See Fatty Acid
-
-
Fatty Acids are stored for later energy use, bound to Glycerol, as Triglycerides
- Insulin promotes Fatty Acid and Triglyceride synthesis (as well as that of glycogen and Proteins)
- Insulin promotes fat cell uptake of Glucose, which may be used to synthesize Fatty Acids
- Fatty Acids are synthesized by adding, in repeated cycles, 2 carbon atoms (from acetyl CoA) at a time
- Three Fatty Acid chains in turn, are bound to one Glycerol to form Triglycerides which are stored in fat cells
- Insulin reduces fat cell intracellular cAMP, thereby reducing Lipase activity (and Triglyceride breakdown)
-
Fatty Acids are burned as fuel in the Kreb Cycle (TCA Cycle)
- Hypoglycemia triggers ephinephrine, Norepinephrine and Glucagon release
- Ephinephrine, Norepinephrine and Glucagon bind cell receptors, trigger cAMP to activate Lipase within fat cells
- Lipase breaks down Triglyceride into its Glycerol backbone and three Fatty Acid chains
- Fatty Acids are degraded (oxidized) by removing, in repeated cycles, 2 carbon atoms at a time (acetyl CoA)
- Glycerol may also enter Glycolysis (via Glycerol-3P to Dihydroxyacetone Phosphate to Glyceraldehyde-3P)
- Energy from each extracted acetyl coA enters the Kreb Cycle
- Each Kreb Cycle generates NADH and FADH2 (total energy 17 ATP per Fatty Acid chain)
- Fats offer high energy stores (9 KCals/g) compared with Carbohydrates and Proteins (4 kcals/g)
- Triglycerides are non-polar and bind less water (more compact than Carbohydrates, Proteins)
- Each triglcyeride contains 3 Fatty Acids, each with 16 to 18 carbons (fueling 24-27 Kreb Cycles)
- In addition, Glycerol, the Triglyceride backbone, may also fuel Glycolysis and the Kreb Cycle
-
Fatty Acid Metabolism may also yield Ketones
- Fatty Acid chains are broken down into multiple acetyl-CoA molecules and a final acetoacetyl CoA
- Acetoacetyl CoA may be further broken down into acetyl-CoA for the Kreb Cycle or converted to Ketones
- Ketones include Acetoacetate, acetone and hydroxybutyrate
- Ketones may be used as fuel by the brain, heart and Muscle
- Ketones are typically generated at times of starvation or with Insulin deficiency (Diabetic Ketoacidosis)
V. References
- Goldberg (2001) Clinical Biochemistry, Medmaster, Miami, p. 4-23
- Guyton and Hall (2006) Medical Physiology, 7th Ed, Elsevier Saunders, Philadelphia, p. 829-58