
II. Indications: Volume status assessment
- Diagnosis
- Volume depleted (e.g. Hemorrhagic Shock, Dehydration, Sepsis)
- Volume overload (e.g. Congestive Heart Failure)
- Serial monitoring of volume status (e.g. Sepsis)
- Repeat Ultrasound measurement after each fluid bolus
- Predict fluid responsiveness (response to IV fluid bolus)
- IVC collapsibility >50% (see Respirophasic IVC Variation below)
- IVC Diameter <2 cm
- Predicts CVP <10 mmHg with Test Sensitivity 85%, Test Specificity 81%
- Prekker ME (2013) Crit Care Med 41(3):833-41 +PMID: 23318493 [PubMed]
- Distensibility Index >18% (see below)
- IVC Change with Passive Leg Raise Maneuver (PLR, see below)
III. Physiology
- Inferior Vena Cava (IVC) diameter is a marker of Preload
- Spontaneous Breathing
- Expiration
- Increased intrathoracic pressure
- Decreased cardiac venous return (slowing flow into the right atrium)
- IVC dilates
- Inspiration (of sniffing)
- Decreased intrathoracic pressure
- Increased cardiac venous return (speeding flow into the right atrium)
- IVC collapses
- Expiration
-
Mechanical Ventilation
- Mechanical Ventilation has an opposite effect on IVC diameter as with spontaneous respiration
- Expiration on Mechanical Ventilation is associated with decreased intrathoracic pressure and IVC collapse
- Inspiration on Mechanical Ventilation is associated with increased intrathoracic pressure and IVC dilation
IV. Precautions
- IVC measurement in estimating fluid status in isolation has limited evidence and high variability, inconsistency
- Pair IVC measurement to other markers (ventricular size and function, Pericardium, B-line artifacts, valve function)
- Short axis measurement of the IVC may be more accurate than longitudinal
- Narrow IVC, but less fluid responsive
- Asthma (increased intrathoracic pressure)
- Abdominal Compartment Syndrome
- Dilated IVC, yet may be more fluid responsive
- Cardiac Tamponade
- Right ventricular dysfunction
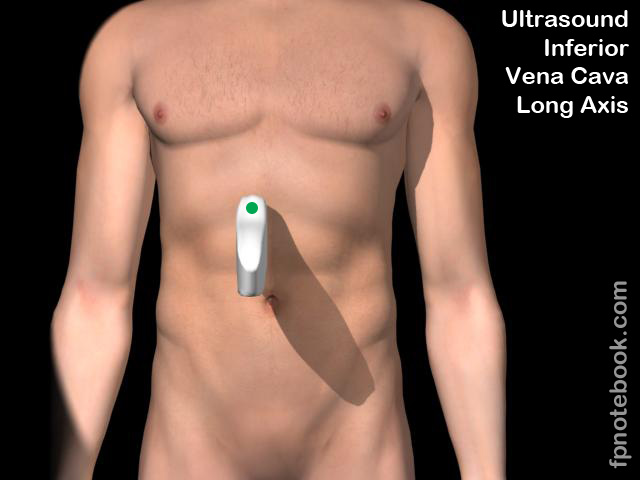
V. Views: Subcostal Longitudinal (volume status view)
- Pearls to improve view window
- View improves with the patient taking a deep inspiration
- Transducer orientation
- Transducer placed right lateral to sub-xiphoid
- Transducer indicator pointed towards 12:00 with energy toward left atrium
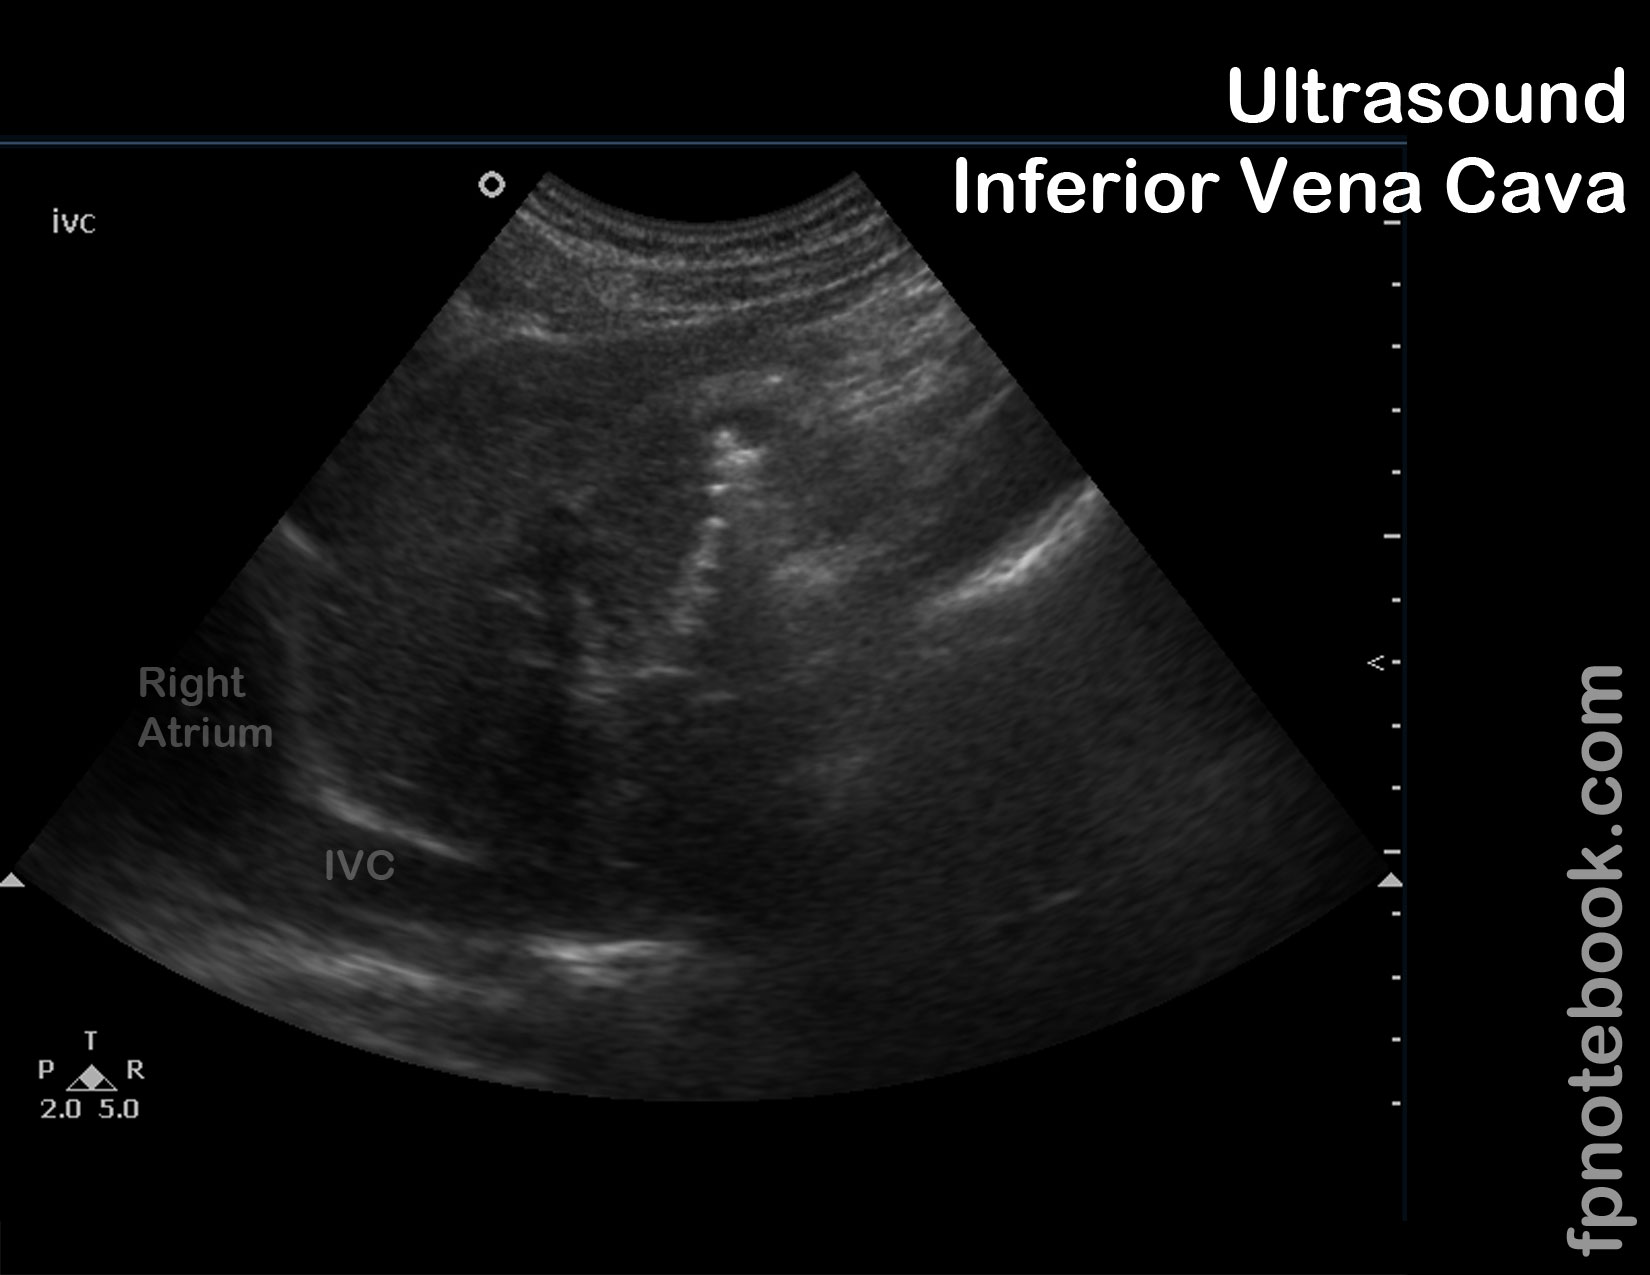
- Landmarks
- Inferior vena cava
- Right atrium
- Images
VI. Interpretation: Volume status based on IVC alone (Respirophasic IVC Variation)
- Inferior vena cava (IVC) is normally 1.5 to 2.5 cm in diameter (measured 3 cm from right atrium)
- IVC <1 cm in Trauma is associated with a high likelihood of Hemorrhage requiring Blood Transfusion
- IVC <1.5 cm suggests volume depletion
- IVC >2.5 cm suggests volume overload
- Inferior vena cava (IVC) normally collapses more than 50% with inspiration or sniffing
- Consider measuring in M-Mode
- Allows for graphical display over time of IVC diameter in both inspiration and expiration
- Caval Index = (IVC-exp diameter - IVC insp diameter) / (IVC-exp diameter) * 100
- Collapse <50% suggests volume overload
- Caval Index >50% suggests fluid responsiveness
- Consider measuring in M-Mode
- Correlation between RA pressure (CVP) and IVC appearance
- CVP 0-5 cm: IVC totally collapses on inspiration and is <1.5 cm in diameter
- CVP 5-10 cm: IVC collapses >50% on inspiration and is 1.5 to 2.5 cm in diameter
- CVP 11-15 cm: IVC collapses <50% on inspiration and is 1.5 to 2.5 cm in diameter
- CVP 16-20 cm: IVC collapses <50% on inspiration and is >2.5 cm in diameter
- CVP >20 cm: No change in IVC on inspiration and is >2.5 cm in diameter
VII. Interpretation: Volume status by Caval Aorta Index
- Step 1: Measure maximal internal IVC anteroposterior diameter (in M Mode)
- Subxiphoid level in longitudinal axis
- Measure just caudal to confluence of hepatic veins (~3 cm from right atrium)
- Step 2: Measure maximal internal aorta anteroposterior diameter (in M Mode)
- Subxiphoid region in longitudinal axis
- Measure just to the left of the IVC
- Step 3: Calculate the Caval Aorta Index as IVC/Ao
- CVP <7 cm H2O: Caval Aorta Index of 0.72 (+/- 0.09)
- CVP 8-12 cm H2O: Caval Aorta Index of 1.23 (+/- 0.12)
- CVP >13 cm H2O: Caval Aorta Index of 1.59 (+/- 0.05)
- Reference
- Sridhar (2012) ISRN Emergency
VIII. Interpretation: Distensibility Index (DI)
- Indication
- Assess fluid responsiveness (expected status change following fluid bolus) in a mechanically ventilated patient
- Contraindications (cases in which DI is unreliable)
- Spontaneous respirations during Mechanical Ventilation
- Tidal Volume <7 ml/kg Ideal Body Weight (based on gender and height)
- Non-sinus rhythm
- Right ventricular dysfunction
- Mechanism
- Mechanical Ventilator generates positive pressure with each breath that distends the IVC
- Positive Pressure Ventilation increases intrathoracic pressure and decreases venous return to the right atrium
- Inferior vena cava distends with PPV delivered breath due to resistance to right atrial filling
- Inferior vena cava returns to baseline diameter between ventilations
- Contrast with IVC collapse with spontaneous breaths (generates negative chest pressure)
- Step 1: Set-up M-Mode view of Inferior vena cava (IVC) for anteroposterior diameter measurements
- Subxiphoid level in longitudinal axis
- Visualize inferior vena cava as it enters right atrium
- Set M-Mode caliper marker at a point 3 cm from the right atrium along the anterior surface of the inferior vena cava
- Measure just caudal to confluence of hepatic veins (~3 cm from right atrium)
- Step 2: Obtain anteroposterior diameter measurements of IVC at maximal and minimal diameters
- Measure maximal internal IVC anteroposterior diameter (inspiratory, Positive Pressure Ventilation phase)
- Measure minimal internal IVC anteroposterior diameter (expiratory phase)
- Step 3: Calculate Distensibility Index (DI) as a percentage
- DI = (maxIVC - minIVC) / minIVC
- Step 4: Interpretation
- Distensibility Index <18% indicates patient is not volume responsive (unlikely to benefit from fluid bolus)
- Efficacy in predicting fluid responsiveness (7 ml/kg bolus) if DI >18%
- Test Sensitivity 90% and Test Specificity 90% for an increase in Cardiac Index of 15% with fluid bolus
- Barbier (2004) Intensive Care Med 30(9):1740-6 +PMID: 15034650 [PubMed]
IX. Protocol: Mechanically Ventilated Patients
- Background
- Consistent intrathoracic pressure of Mechanical Ventilation (MV) results in most predictable results
- Interpretation depends on paralyzed patient without spontaneous breathing on TV 10-12 ml/kg
- Also depends on normal sinus rhythm, normal RV function and a PEEP that is not high
- Measurement
- Use M-Mode to measure the minimal and maximum IVC diameter in one respiratory cycle
- Percentage change = (max-min)/min * 100
- Fluid tolerant if percentage change >18%
- References
X. Protocol: IVC change with Passive Leg Raise (PLR) in Prediction of Volume Responsiveness
- Technique
- Obtain initial maxium and minimum IVC measurements
- Perform Passive Leg Raise Maneuver (PLR Maneuver)
- Repeat maxium and minimum IVC measurements
- Interpretation
- Improved hemodynamic parameters by IVC measurement suggests volume responsiveness (benefit with fluid bolus)
XI. Resources
- Inferior Vena Cava Ultrasound Video (SonoSite)
- Echocardiographer
XII. References
- Hallemat (2013) Crit Dec Emerg Med 27(10): 14-21
- Swaminathan and Mallemat (2026) IVC Ultrasound, EM:Rap, 3/9/2026
- Furtado (2019) Rev Bras Ter Intensiva 31(2):240-7 +PMID: 31271627 [PubMed]